BIG NEWS: ConvertKit is becoming Kit. Learn more

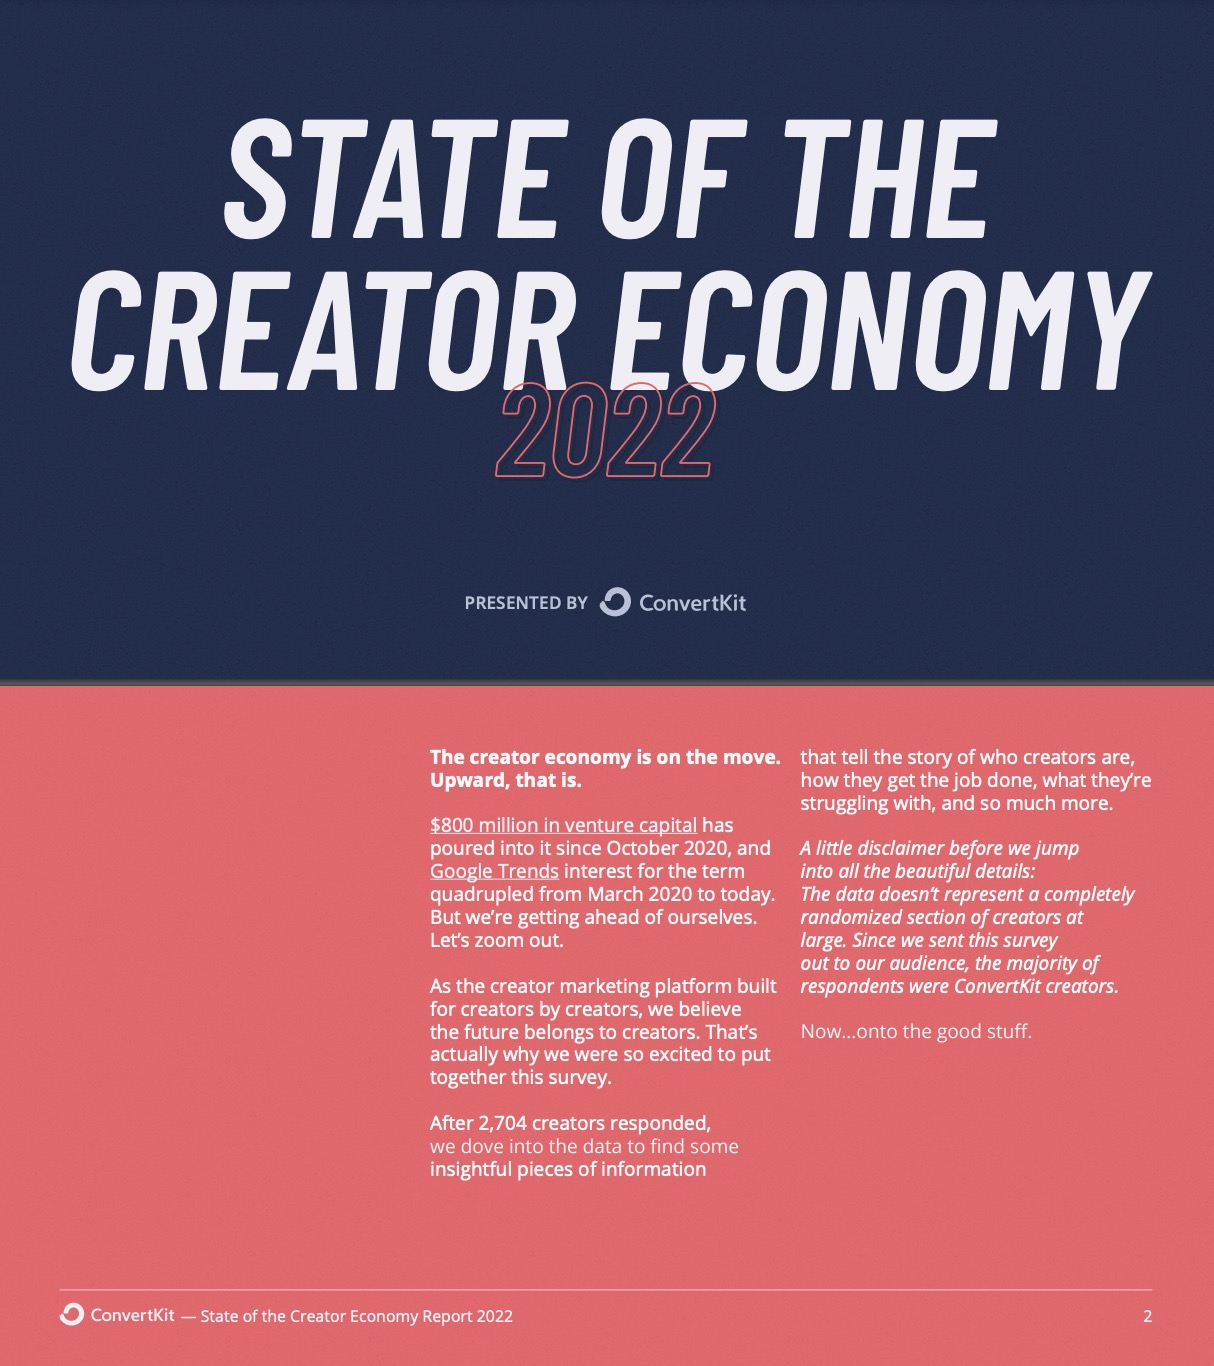
STATE OF THE CREATOR ECONOMY

2022
Presented by
2,704

The creator economy is on the move. Upward, that is.

This review of the Creator Economy in 2022/ is the culmination of 2,704 creators sharing their experiences.

Together, these creators bring over 11,000 years of combined audience-building expertise and $66 million in 2021 earnings.

01
01

Creator is a wide-ranging label

People are at the heart of the creator economy—it’s even in the name. Before looking at what creators did this year, it’s only fitting to learn who they are first.

From the coaches and artists to the married with kids and the 71-year-old creators, and even the 24% of creators who got their start during the pandemic; if you’ve ever doubted whether it was possible to be a full-time creator, buckle up—it’s not as rare as you might think.

Creator Types

Bar chart of the ten most common types of creators which are, in order of most common: educator, blogger, coach, writer, artist, designer, marketer, author, YouTube and podcaster.

Creator Status

Pie chart showing the status of creators who responded to the survey where 46.7% are full-time creators, 42.7% create part-time and 10.6% are hobbyists.

Gender Distribution

Bar chart of the gender distribution of responses where 63.8% of respondents are female, 34.6% are male and 1% are non-binary.
02
02

Creators are gonna create

There’s no one type of person who becomes a creator, and there is most certainly not one type of content they create.

In 2021, we saw social media posts, emails, courses, long-form and short-form videos and more coming from creators…and often all at the same time.

Content Types

Bar chart of types of content created in 2021 compared to plans for 2022 where social media posts, articles and email newsletters are the most common choices and email newsletters shows the most growth from 2021 to 2022.

Video Length

Bar chart of the use of long form vs short form video by creator type where YouTubers is the only creator type where long form video is more popular to create than short form video.

Content Topics

Two bar charts of the top 5 content topics for full-time creators and hobby creators where the top 5 for full-time creators shows business focussed topics like marketing and entrepreneurship and the top 5 for hobby creators shows more creative topics like art and design, although personal development is present in both charts.

get the full report

We're just scratching the surface. Download the full report to get more insights into the current state of the creator economy.

03
03

The myth of the overnight success

Stories of YouTubers going viral with their first video may be exciting, but for most creators, building an audience is a marathon, not a sprint.

In fact, 67% of full-time creators started more than 3 years ago, and just over a quarter began growing an audience a decade or more ago.

So the next time you feel like comparing your journey to another creator’s, remember that things worth doing can take time.

Length of time by creator type

Bar chart comparing creator status to how long ago they started building an audience, where full-time creators are most likely to have been creating for 10+ years, part-time creators most commonly for 1–2 years and hobbyists for less than a year.

length of time by income level

Bar chart comparing annual income bracket to how long ago the creator started building an audience where creators earning  more than $100,000 annually are most likely to have been creating for more than 6 years.
04
04

The creator middle class exists

It’s true. The creator economy isn’t full of overnight sensations making celebrity-level cash and struggling content creators.

22% of full-time creators are sitting pretty in that middle class revenue range between $50,000-$150,000.

Whether a creator is full-time, part-time or creating as a hobby, there is money to be made from products, services, memberships, and more.

Annual revenue

Bar chart of annual revenue for full-time creators compared to part-time creators where the majority of part-time creators earn less than $10,000 and full-time creators are much more likely to be earning in the higher income brackets.

The creator marketing platform

Whatever you make, make it known with ConvertKit

Start a free trial
14-day free trial. No card required. Cancel anytime.
05
05

The creator economy’s gender pay gap

Did you know that female creators outnumber male creators by nearly 2:1 and they were most likely to have earned revenue in 2021? ‍

However, men were more than twice as likely to earn over $150,000 annually than women, and overall 35% of men are earning over $100,000 compared to just 19% of women.

So while we’re excited to see more female creators taking control of their earnings, there’s still progress to be made when it comes to closing the pay gap.

income brackets

A bar chart of the breakdown of annual income brackets by creator gender where male creators are more than twice as likely to earn over $150,000 per year than female creators.

sponsorship income

A bar chart of monthly income male creators earn from sponsorships compared to female creators where men are more likely to earn more than $5,000 a month than women.
06
06

Can money buy happiness?

If you’ve ever wondered if money buys happiness, it does…to an extent.

While we know that a certain amount of money isn’t the only definition of success, it is important to the livelihood of creators and does in fact have an impact on how they view their work and their happiness in that work.

‍On average, creators rate their happiness with their work as a 6.6/10. But where do those happy creators fall in the revenue range?

average happiness levels

A bar chart of the average happiness level on a scale from 1 to 10 of full-time creators where creators in the ‘more than $150,000’ income bracket have an average of 7.9, creators who earned less than $10,000 have an average of 7 and creators who didn’t earn revenue in 2021 have an average of 6.3.

top success metric

A bar chart of the top methods creators use to measure success where revenue is the most common answer, followed by engagement, email subscribers, followers, then website visitors.

get the full report

We're just scratching the surface. Download the full report to get more insights into the current state of the creator economy.

07
07

Engagement > followers

When it comes to fans, followers, and subscribers, creators are finding that the secret sauce to happiness and success is in engagement instead of the numbers.

Creators focusing on audience engagement reported slightly more happiness on average than those who measured by follower count. And for 52% of creators, the platform they most enjoyed creating on was also the one with the most engagement.

‍We don’t know whether high audience engagement makes the site more enjoyable or if having more fun on a platform leads to more engaged audiences. But these numbers speak for themselves.

Top engagement channels

Bar chart of the channels that full-time and part-time creators said led to the most engagement for them where Instagram is the most popular answer for both full-time and part-time creators, but email follows closely for full-time creators.

Channels used

Bar chart of the channels that full-time and part-time creators said led to the most engagement for them where Instagram is the most popular answer for both full-time and part-time creators, but email follows closely for full-time creators.

social media success metrics

Bar chart of the top metric full-time creators use to measure their success on social media where follower growth is the most popular answer, followed by engagement.
08
08

The value of emailing weekly

Full-time creators ranked the importance of email to their business at 8.3/10.

Spoiler alert for the full, downloaded report—this rating means professional creators think email is more important to their business than social media or paid ads.

‍If you want to send emails like the pros, making an effort to grow and nurture your audience pays off in the long run. So 2022 is the year to start your email list, even if you feel like a small fish in a big pond.

channel importance

A grouped vertical bar chart of the importance of email, social media and paid advertising to a creators business on a scale of 1 to 10 split by full-time, part-time and hobby creators, where email is ranked as most important for both full-time and part-time creators with a score of 8.3 and 7.7 out of 10 respectively.

email schedule

A grouped vertical bar chart of the importance of email, social media and paid advertising to a creators business on a scale of 1 to 10 split by full-time, part-time and hobby creators, where email is ranked as most important for both full-time and part-time creators with a score of 8.3 and 7.7 out of 10 respectively.

The creator marketing platform

Whatever you make, make it known with ConvertKit

Start a free trial
14-day free trial. No card required. Cancel anytime.
09
09

The Distribution of work

When you’re your own boss, you can set your schedule. But when you have big ideas, goals, and to-do lists, finding work/life balance can be tricky.

‍Do you hire contractors? Can you change up the amount of time you work in a week?

A significant portion of full-time creators don’t plan on adding to their solo run business, so 2022 needs to be the year of multiple revenue streams, self-growing strategies, and email automations for greater impact with less hands-on time.

hours worked

Vertical bar chart of hours worked weekly by full time creators in 2021 compared to their plans for 2022 as a percentage of full-time creators where most people worked more than 40 hours a week in 2021 but plan to work between 30-40 hours a week in 2022.

solo work

Three donut charts showing that 37% of full-time creators worked totally solo on their business in 2021 compared to 55% of part-time creators and 75% of hobbyists.

help in 2021

Bar chart of the types of help full-time creators hired in 2021 where regular contractors is the most popular answer at around 55% of full-timers choosing this option compared to 32% hiring part-time employees and 21% hiring full-time employees.

hiring in 2022

Bar chart of the hiring plans for full-time creators in 2022 where the majority are either staying solo or keeping their team as it is, but nearly 30% are planning on hiring contractors to help with their business.
10
10

Creator burnout is widespread

The prolonged stress of burnout can spiral into mental exhaustion, apathy for your work, or a lack of motivation and creativity. And unfortunately, it’s a prevalent enemy in the creator experience.

‍‍61% of creators experienced burnout in 2021.

‍Thankfully, creators are taking steps to shake off the stress. Whether it’s taking dedicated breaks, getting their bodies moving, finding themselves in the great outdoors, or slowing down for self-reflection, creators are finding ways to kick burnout to the curb.

Burnout status

Three donut charts, one each for full-time, part-time and hobby creators indicating that more than half of each group have experienced burnout in the last twelve months.

burnout causes

Horizontal bar chart showing the top causes of burnout for full-time creators, listed in descending order; the pressure to post content everywhere, content fatigue, general pandemic stress, the emotional labor of being a personal brand and showing up authentically, not being able to mentally disengage, comparison culture, feeling siloed/working alone, feeling alone because of the pandemic and something else.

These passionate creators are taking matters into their own hands, breaking away from traditional work, and embracing creativity to change the way the world works.

Being a creator may not be a new concept, but the impact of the creator economy is just getting started.

We believe the future belongs to these creators.

Are you ready to change the world with them?

get the full report

We're just scratching the surface. Download the full report to get more insights into the current state of the creator economy.