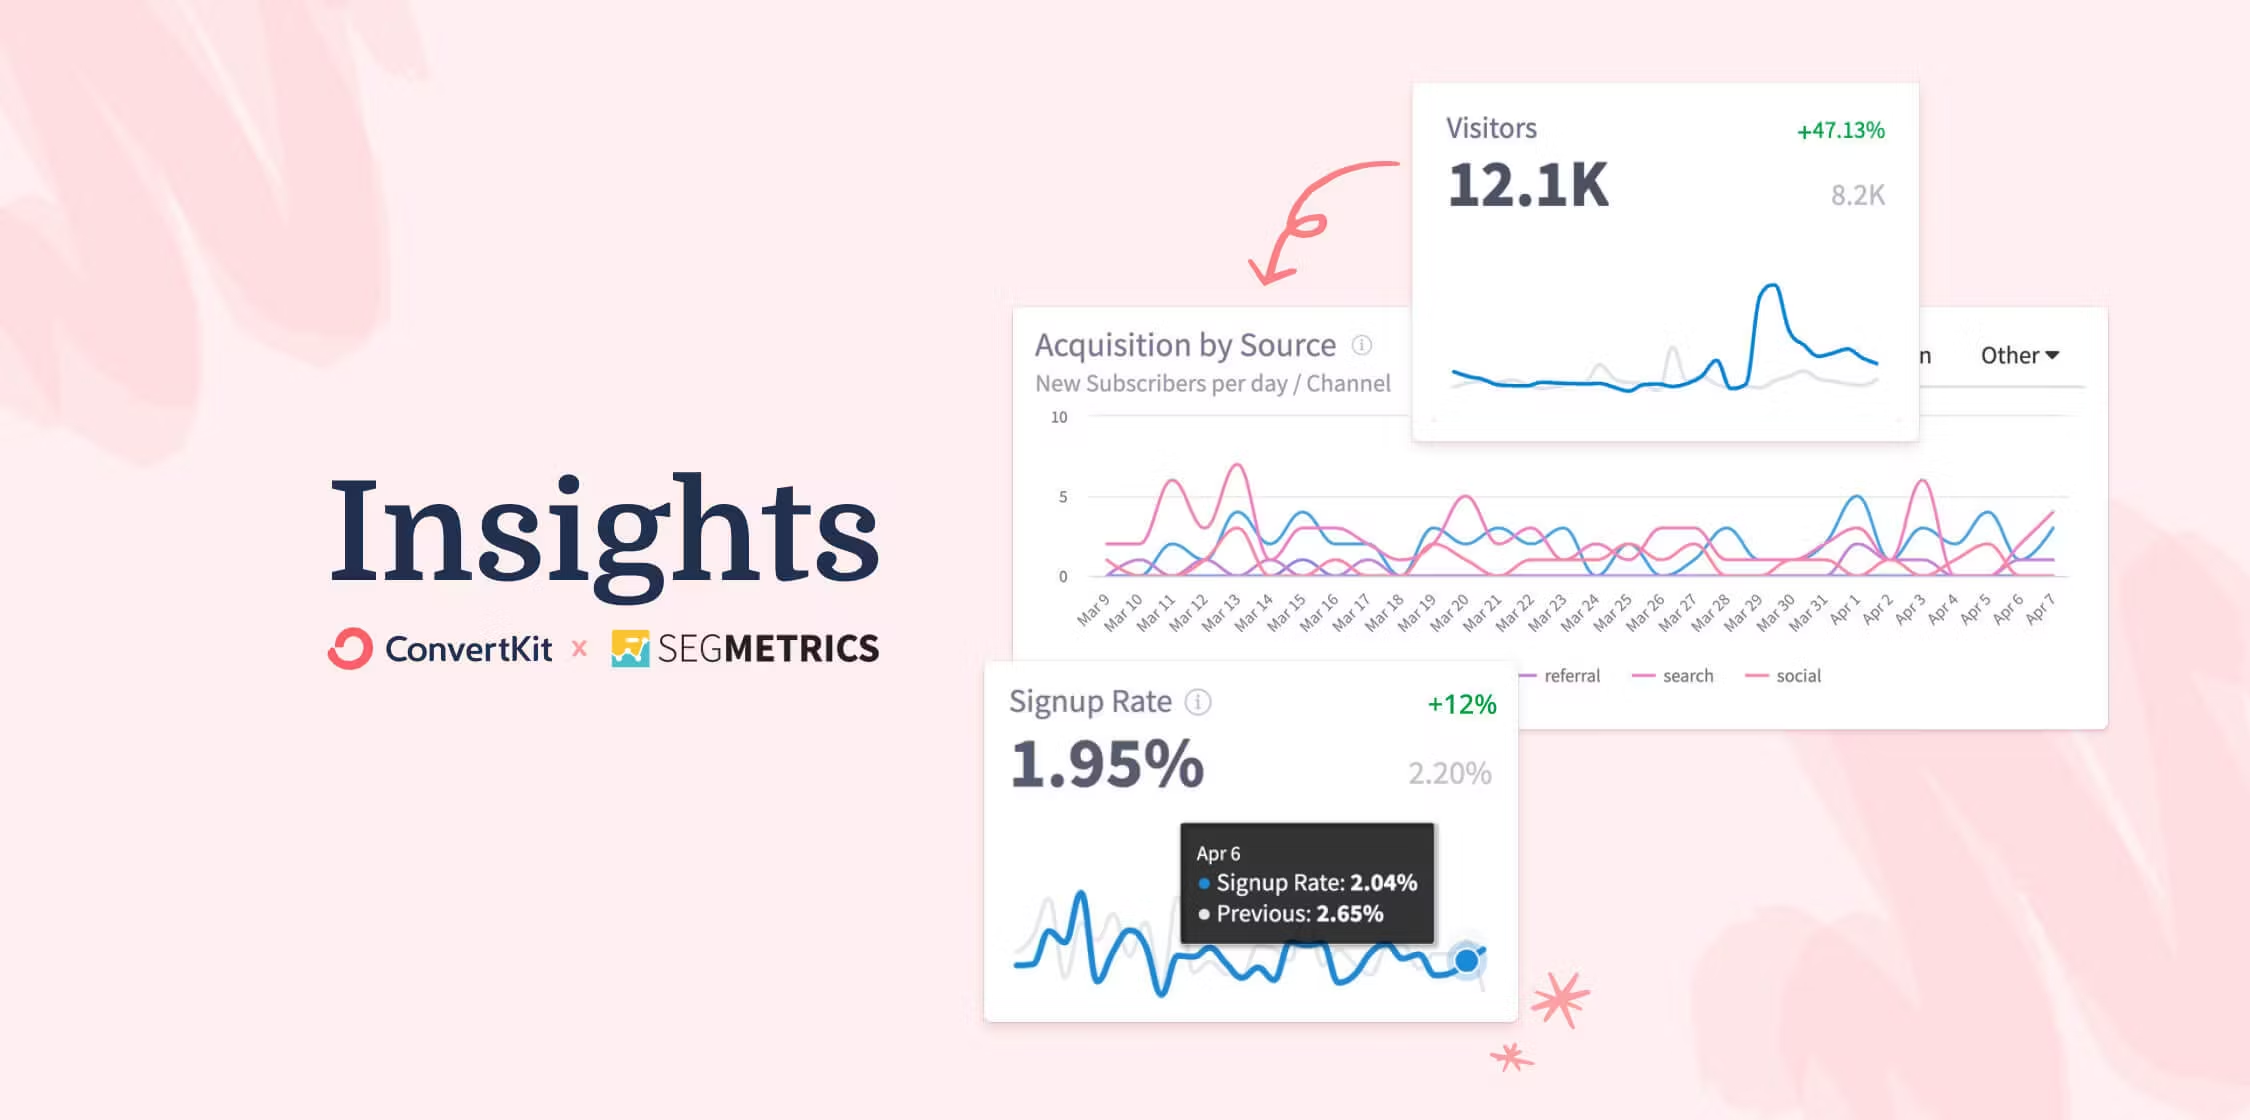
Upgrade your data game with Kit’s new dashboard, Insights
Kit is built for creators to start, grow, and scale their creator business. One key element in any business is data—to access it, understand it, and most importantly, to use it to further your efforts to grow your business.
Insights, Kit’s new advanced analytics dashboard, will give you a comprehensive look at how your traffic turns into subscribers, and then converts into customers—all in one place in our Pro plan.
In partnership with SegMetrics, we’ve teamed up to deliver a dashboard that you can use to answer all the burning questions you have about where your subscribers are coming from, which email generates the most sales, how much it costs to acquire a subscriber, and more.
Let’s dive into all the details on how Insights can increase the impact of your work.
Identify what’s driving growth, engagement, and sales
We know that as creators you crave information. You want data about your subscribers and your work to know where to get the highest return on investment. Now with Insights, you can do so without cobbling data from different integrations to make sense of your subscriber journey.
In Insights, there are four dashboards that highlight data from different stages of your marketing funnel.
Acquisition dashboard
This dashboard shows you where your subscribers are coming from. Whether you have a website or solely use Kit landing pages, you’ll have a view of your website traffic and a breakdown of how those traffic numbers turn into subscribers.
Use this dashboard to answer the questions:
- Which page on my website converts the most traffic into subscribers?
- Which form do most of my customers originate from?
- What is my overall sign up rate?
- How much does it cost for me to acquire a new subscriber?
Engagement dashboard
This dashboard shows how engaged your subscribers are by looking at specific segments, emails, and revenue. The deliverability reports you have on Kit focuses on how engaging your content is, whereas this dashboard focuses on how engaging your subscribers are—a look at the other side of the coin.
Use this engagement dashboard to answer:
- Which segment of my subscribers are most engaged?
- How long do my subscribers stay engaged for?
- What segment of my subscribers bring in most revenue from sales?
- Which emails generate the most sales?
- Where are the biggest drop offs in my customer journey funnel?
Sales dashboard
With the sales dashboard, you can gain more information about who is purchasing your Commerce products. You can also get a better understanding of who your ideal customer is and how you can tweak your marketing efforts to drive more of those subscribers to your list.
Use this dashboard to to answer:
- What is the average order quantity of a customer?
- Which channel/form do most of your customers join your list?
- Which products are often purchased by the same customer?
- Who are your best customers?
Velocity dashboard
Velocity is the measure of the speed of something moving in a direction. In Kit we’re talking about the speed in which your site visitors turn into customers. This helps you set a benchmark of how effective your overall marketing is.
Use this dashboard to answer these questions:
- How many of your subscribers turn into customers?
- How long does it take for them to purchase a product?
- Which segment drives most sales?
Market your creator business like a Pro
Our partnership with SegMetrics gives you dashboards that you can filter by time period, subscriber attributes (including custom fields), and pages visited to get the information that you need to strengthen your business. This will give you everything you need to improve your sales and marketing flywheel to keep growing with ease.
If you’re a creator looking to level up your business, upgrade to Creator Pro today to unlock Insights and make sense of your audience’s behavior.


